Our #1 goal at the Web Designer Academy is to help women web designers create profitable, sustainable web design businesses that give them freedom, flexibility and financial independence.
This is our second year asking web designers what they charge, earn and struggle with – and with 82% of respondents reporting that they are not satisfied with their income, it’s clear that we have more work to do to help web designers stop undercharging, overdelivering, overworking and start implementing effective, doable marketing strategies that work.
Pricing is hands-down the most powerful tool every web designer has in their toolbox to make an immediate impact on their income right now – on their very next proposal.
When you’re charging what you really could be charging, you don’t need as many clients to make the money you want to be making. That means an easier marketing strategy, and less administrative overhead, and less project management and client management headaches.
That’s one of the three main things we help our Web Designer Academy students do: implement our Package Matrix™ Method in their web design business: a strategic pricing methodology that helps you charge more now from the work you’re already doing. The other two things we help our clients do? Use the right marketing strategies for their business model to make marketing easier, and put easy-to-hold boundaries in place with their clients to prevent overworking and scope creep, which aside from undercharging is the other biggest place web design businesses lose money.
What I know from over a decade of coaching and mentoring web designers is that you don’t have to wait to charge more.
You simply need a pricing and proposal strategy that makes it way easier to put those higher numbers out there without so much risk. That’s what we help you do inside the Web Designer Academy. Learn more about it here.

Shannon Mattern is the founder of Web Designer Academy and the creator of the Package Matrix™ — a three-option offer framework she developed over a decade of working with thousands of women web designers who were talented, fully booked, and still underearning. Her pricing methodology is now used by service providers across industries, and she hosts the Profitable Web Designer Podcast.

Think of this report as a pulse check on the web design industry — a snapshot of what designers are charging, struggling with, and experimenting with in 2026.
This year’s respondents are more established than last year’s: 52% have been in business six years or more, up from 42%.
| Group | 2026 | 2025 |
|---|---|---|
| Female | 90% | 85% |
| Male | 10% | 13% |
| Age 30 to 49 | 69% | 72% |
| Age 50+ | 22% | 16% |
| Runs business full-time | 65% | 62% |
| Part-time | 23% | 22% |
| Side business alongside a day job | 13% | 6% |
| In business under 6 years | 48% | 58% |
| In business 6 to 10 years | 24% | 22% |
| In business 11+ years | 27% | 20% |
| Works alone | 58% | not reported |
Most designers that answered this survey are women in their 30s and 40s running full-time businesses. The share of side businesses doubled, and those designers mostly sit in the under-$10k band (46% of that band run the business next to a day job).
40% of designers earned $50,000 or more in 2025, up from 34% in last year’s report. 60% earned under $50,000 (66% last year), and 35% earned under $25,000 (47% last year).
40% of respondents earned $50,000 or more in 2025.
No Data Found
No Data Found
2026 Web Designer Pricing Survey, 124 responses, Mar to May 2026
Designers paid themselves about 55% of revenue on average, a little below last year’s 60%. That is an estimate from band midpoints. 40% paid themselves less than $10,000 in 2025, including 7% who paid themselves nothing.
New this year: 82% said no. Satisfaction climbs with revenue, but even at the top band most designers want more.
Even at $75k+, only 1 in 3 designers is satisfied with their income (18% overall).
No Data Found
No Data Found
2026 Web Designer Pricing Survey, 124 responses (new question in 2026)
31% of men and 26% of women reported $75,000+ in revenue. The gap is narrower than last year’s (26% vs. 18%), but only 13 men responded.
Revenue grows with tenure and with going full-time: 94% of $75k+ designers run their business full-time. The more interesting signal is satisfaction. Earning more doesn’t settle the question on its own, which points to how the money is earned (hours, scope, project size), not just how much.

Stop undercharging and start owning the value of your work. This guide walks you through pricing your services in a way that’s profitable and sustainable.
Get the Guide ⟶
60% call themselves freelancers and 36% call themselves agency owners (69% and 24% last year). The agency title tracks revenue: 64% of $75k+ designers call themselves agency owners, compared with 7% of those under $10k.
| Specialty | 2026 | 2025 |
|---|---|---|
| Web Designer | 86% | 77% |
| Graphic Designer | 35% | 52% |
| Brand Strategist | 32% | 35% |
| Web Developer | 32% | not reported |
| More than one specialty | 60% | 81% |
58% work alone. 29% sometimes use subcontractors, 9% always do, and 4% have employees. At $75k+, only 21% work alone, while 89% of under-$10k designers do.
Fewer designers are wearing every hat this year, and more are calling themselves web designers first. The jump to agency-level revenue almost always comes with help, usually subcontractors rather than employees.
78% use a package rate as their primary fee structure, down slightly from 82%. Hourly is next at 9%, then subscription or retainer models (5%) and day rates (3%). Package pricing leads in every revenue band, from 71% to 86%. Subscription and retainer models are most common at $75k+ (9%).
The most common average website project price is $2,500 to $4,999 (44% of designers). 64% fall between $2,500 and $9,999, up from 57%. 26% average $5,000 or more, and 6% average $10,000 or more, up from about 2% last year.
| Average project price | Share |
|---|---|
| Under $1,000 | 6% |
| $1,000 to $2,499 | 25% |
| $2,500 to $4,999 | 44% |
| $5,000 to $9,999 | 20% |
| $10,000+ | 6% |
94% of $75k+ designers average $2,500+ per project, vs. 25% under $10k.
No Data Found
No Data Found
2026 Web Designer Pricing Survey, 124 responses
The pattern matches last year almost exactly.

83% of respondents gave an hourly rate for the time they sell hourly, even though only 9% use hourly as their main pricing model. The average rate is $108 and the median is $100 (last year: $100 and $92.75).
| 2025 revenue | 2026 average | 2026 median | 2025 average |
|---|---|---|---|
| Under $10k | $99 | $85 | $76 |
| $10k to $24,999 | $83 | $75 | $79 |
| $25k to $49,999 | $116 | $125 | $103 |
| $50k to $74,999 | $107 | $100 | $111 |
| $75k+ | $122 | $125 | $131 |
Top earners still charge the most per hour, but the spread between bands is narrower than last year. Rates are about the same for women ($108) and men ($107).
New this year: 73% offer payment plans. Designers who offer them are more likely to average $5,000+ projects (29% vs. 18% of those who don’t).
Hourly rates explain little about who earns more. Project size does. Nearly every $75k+ designer has moved past the $2,500 mark, and a majority have moved past $5,000. Payment plans look like one way designers make bigger packages easier to say yes to.

Feeling like you have to wait six months—or even a year—before raising your web design prices? That delay isn’t necessary.
20% charge for discovery before giving a full proposal, up from 15%. Another 27% plan to start. 37% don’t plan to, and 15% had never heard of paid discovery.
| Charges for discovery? | Share |
|---|---|
| Yes | 20% |
| Not yet, but I plan to | 27% |
| No, and I don’t plan to | 37% |
| Never heard of it | 15% |
Designers who charge for discovery are 2.7 times as likely to average $5,000+ projects (52% vs. 19%), and more likely to earn $75k+ (40% vs. 23%). Use of paid discovery climbs from 11% under $10k to 30% at $75k+.
Last year discovery-chargers were about twice as likely to land $5k+ projects. This year the gap is wider. Discovery doesn’t cause bigger projects on its own, but it tends to come with a more structured sales process, and that shows up in project size.

Half of designers (49%) got less than 20% of their 2025 revenue from recurring sources like care plans or retainers, and a third (33%) got under 10%. A quarter (24%) got half or more of their revenue from recurring work.
Recurring revenue rises with revenue. 61% of under-$10k designers had under 10% recurring, compared with 15% at $75k+. Last year even top earners leaned almost entirely on projects. This year 64% of $75k+ designers got at least 20% of revenue from recurring work.
Recurring revenue is still the top challenge for designers above $50k (see Business Challenges). The ones who have solved it are mostly in the top band.
Nearly everyone offers web design (97%). Strategy and development services rise with revenue: at $75k+, 73% offer brand strategy and 76% offer web development, compared with 46% and 50% under $10k.
| Service | 2026 | 2025 |
|---|---|---|
| Web design | 97% | 87% |
| Graphic design | 57% | 65% |
| Web development | 57% | not reported |
| Brand strategy | 54% | 59% |
| SEO | 48% | not reported |
| Copywriting | 39% | not reported |
| Marketing strategy | 31% | not reported |
| UX/UI design | 23% | not reported |
| AEO (answer engine optimization) | 18% | new option |
| Conversion rate optimization | 17% | not reported |
AEO is new on the list this year and already offered by 18% of designers, rising to 30% at $75k+.
Platforms: WordPress 65% (61% last year), Squarespace 37% (38%), Shopify 18%, Wix 15%, Showit 11%, Wix Studio 9%, Webflow 7%, Kajabi 6%.
New this year: 77% built between 1 and 9 websites in 2025, and 19% built 10 to 19. Only 2% built 20 or more. Most designers juggle one to three projects at a time (77%); 11% run five or more at once.
New this year: 66% invest less than $250 a month in business and professional development, including 13% who invest nothing. At $75k+, 33% invest $500 or more a month. No one under $10k does.
A typical designer builds fewer than ten sites a year. At that volume, each project’s price matters far more than how many you can fit in. Top earners also sell more strategy and invest more in their own growth.
Getting more clients is still the number one challenge (52%), followed by creating consistent recurring revenue (42%) and improving processes (37%). Selling and pricing were named less often than last year.
Getting clients is still the top challenge, named by 52% of designers.
No Data Found
No Data Found
2026 Web Designer Pricing Survey, 124 responses
By revenue band: “Get more clients” peaks at 88% for $10k to $24,999 designers and falls to 36% at $75k+ (84% and 41% at the ends last year). Above $50k, recurring revenue becomes the top challenge. At $75k+, time (36%), work/life balance (33%) and managing a team (33%) move up the list.
The problem changes as the business grows. Early on it’s finding clients. Later it’s making revenue predictable and getting your time back.

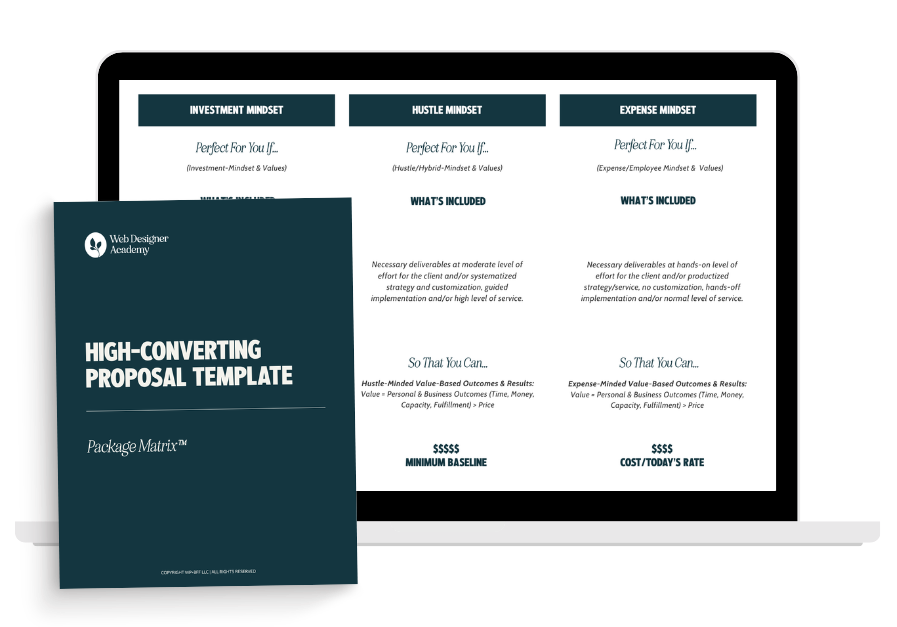
Your next proposal could be the one that changes everything. This free template shows you what to include (and what to leave out) to get more yesses at prices that feel worth it.

Discover the 5 subtle proposal mistakes even experienced web designers make that cost them thousands — and what to do instead.
91% use word of mouth and 79% say it’s among their most effective strategies, almost the same as last year (91% and 81%). Social media is the clearest gap: 55% use it, but only 17% call it effective.
Most designers market everywhere, but referrals do the work.
No Data Found
No Data Found
2026 Web Designer Pricing Survey, 124 responses
Word of mouth is the top effective strategy in every revenue band, from 64% under $10k to 94% at $10k to $24,999. At $75k+, SEO (24%), social media (24%) and online networking (24%) are the next most effective.
The typical designer uses five marketing strategies, while one of them brings in most of the work. Making referrals easier to give, and turning them into higher-priced projects, is where the leverage is.
| Measure | 2025 report | 2026 report |
|---|---|---|
| Responses | 208 | 124 |
| Earn $50k+ | 34% | 40% |
| Earn $100k+ | 12% | 15% |
| Earn under $25k | 47% | 35% |
| Package rate as primary model | 82% | 78% |
| Average projects $2,500 to $9,999 | 57% | 64% |
| Average projects $10k+ | about 2% | 6% |
| $75k+ designers averaging $2,500+ | 97% | 94% |
| Under-$10k designers averaging $2,500+ | 25% | 25% |
| Average hourly rate | $100 | $108 |
| Median hourly rate | $92.75 | $100 |
| Charge for paid discovery | 15% | 20% |
| Discovery-chargers vs. others at $5k+ projects | about 2x | 2.7x |
| Owner pay as share of revenue | about 60% | about 55% |
| Use word of mouth | 91% | 91% |
| Word of mouth most effective | 81% | 79% |
| Top challenge: getting clients | 66% | 52% |
| Agency owner title | 24% | 36% |
Samples differ between years, so read changes as directional. 2026 respondents have been in business longer, which likely explains part of the revenue gain. See the full 2025 report for last year’s results.

No content hamster wheel, no social media burnout. This guide shows you how to consistently market your web design business in just minutes a week — even in a saturated market.
The most common average project price is $2,500 to $4,999, reported by 44% of designers in our 2026 survey. 26% average $5,000 or more, and 6% average $10,000 or more.
60% of designers earned under $50,000 in 2025 and 40% earned $50,000 or more. 15% earned $100,000 or more. Owner pay averaged roughly 55% of revenue.
The average is $108 an hour and the median is $100. Designers earning $75,000+ average $122 an hour.
By package. 78% use a package rate as their primary fee structure. Only 9% price primarily by the hour.
In this year’s sample, hourly rates were about the same for women ($108) and men ($107). 31% of men and 26% of women earned $75,000+, but the male sample is small (13 respondents).
Paid discovery means charging for a strategy or planning session before giving a full proposal. 20% of designers do it. Those who do are 2.7 times as likely to average $5,000+ projects.
Half get less than 20% of revenue from recurring sources like care plans or retainers. Among $75k+ designers, 64% get at least 20% from recurring work.
Most are not. 82% said no, including two in three designers earning $75,000 or more.
Getting more clients (52%). Above $50,000 in revenue, creating consistent recurring revenue becomes the top challenge.
Word of mouth. 91% use it and 79% name it among their most effective strategies. Social media is used by 55% but rated most effective by only 17%.
WordPress (65%), then Squarespace (37%), Shopify (18%) and Wix (15%).
